
Earlier this year my team had a chance to compete in a hackathon. Effectively we were told to take our experience in the field, identify an issue that had been difficult to solve or detect with the existing toolset, and then solve it by (mostly) any means necessary.
Speaking as someone that had been hand curating artisanal Python scripts and Jupyter notebooks, this was a welcome challenge but also a heck of a learning curve. This post is two parts – one that walks through the problem I looked to solve, and one that reflects on the lessons learned in the process and my thoughts on the changes in the industry.
Problem Statement:
Many metrics within Mist are focused on the client experience – can your clients connect to the network, can they roam from one AP to another, are they experiencing congestion, the list goes on – and each site continuously reports this data into the system.
The trick that I’ve run into is that a site can look healthy overall but there can be a small subset of clients experiencing issues within the site. For example, if you have 500 total clients and five of them are failing authentication, that’s still an “A+” site in the grand scheme of things. But what if those five devices that are failing are critical? What if those failing clients are all of the available medical carts in the hospital wing?
There’s a fine balance between being overloaded with unnecessary alarms and missing a key detail. I set out to solve this by applying ML techniques against client event records.
My Approach:
First, the system makes two API calls to Mist. One call pulls the client cache, and one call pulls the client events. The data is stored in a SQLite database.
Second, the system enriches the client events with the device fingerprint information from the client cache.
Effectively, an authentication failure client event is no longer just an authentication failure – it is now an authentication failure for a macOS device running Catalina (as an example). This enriched dataframe is what enables this system.
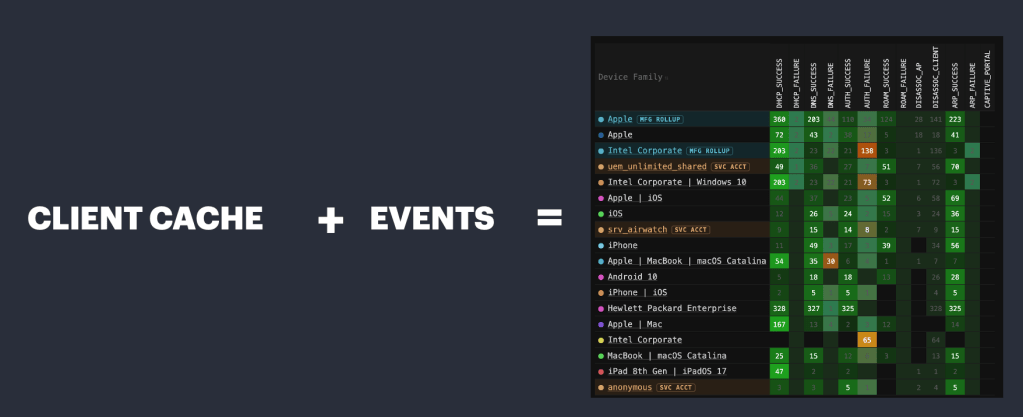
Third, create a “health score” for each device and device family based on the event mixture – failures in authentication / DNS / DHCP / roaming reduce the score, successes increase the score, and scores are tracked in each connectivity vector.
Fourth, apply a bunch of fun ML techniques to the dataset to build a baseline for each site/WLAN combination, look for anomalies that don’t match the rest of the site, and create an “anomaly score” for each device and device family.
Finally, create an alerting structure that warns the team if there is a device family out there that is both anomalous AND unhealthy.
Here’s the high-level flow going from left to right:
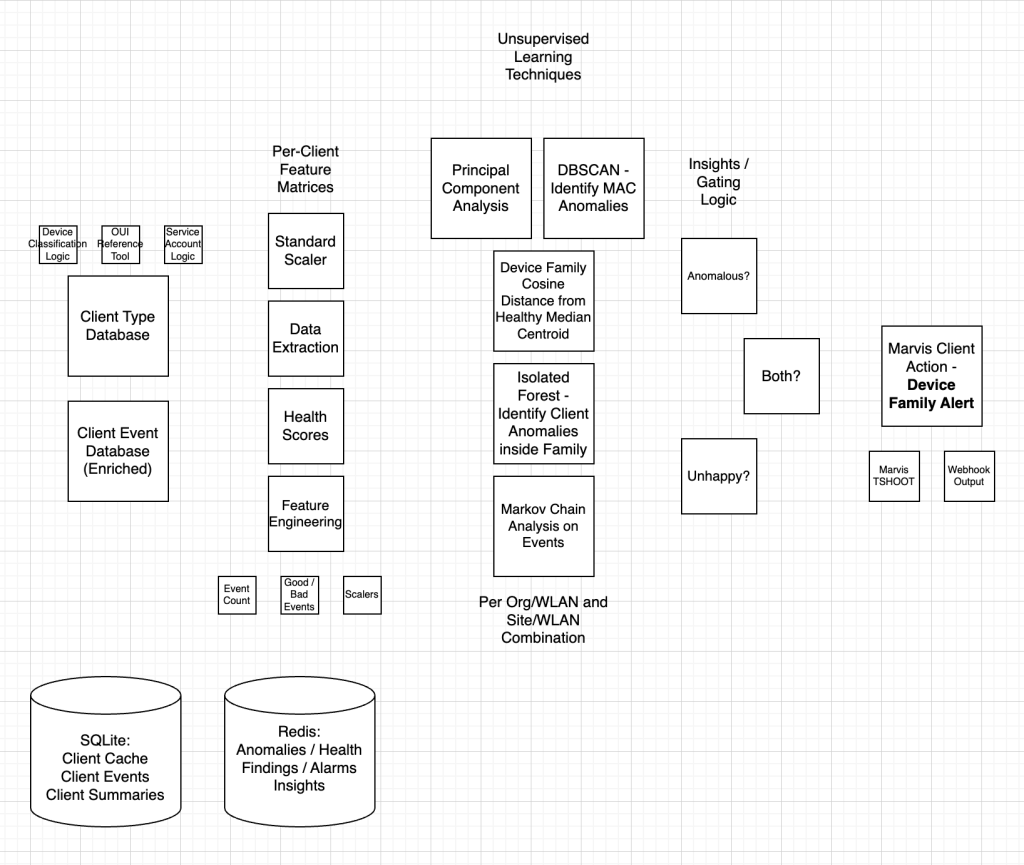
Everything runs locally in this system; there are no calls to external intelligence providers.
Data Science Techniques:
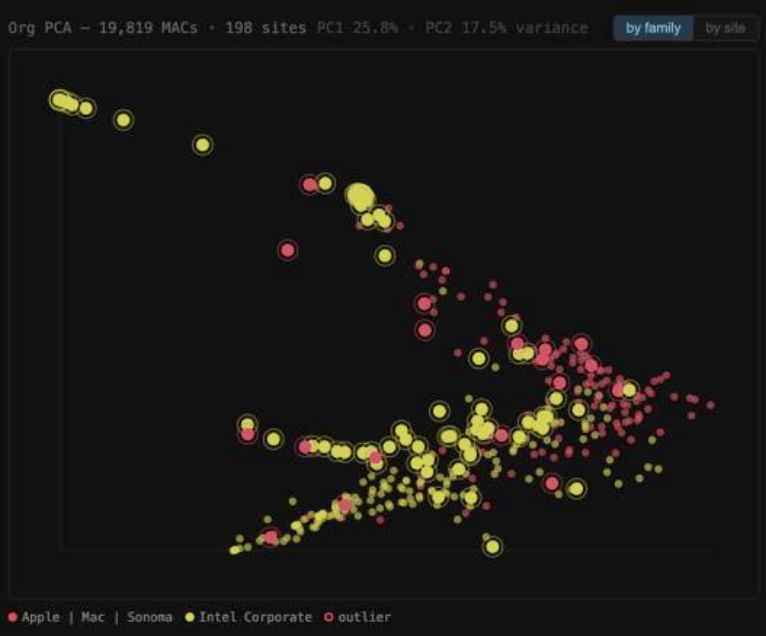
Using principal component analysis techniques we can visually see if there is a stark difference between client vendors and how they behave on the network – as an example, this shows that there is a behavioral difference between Mac Sonoma and Intel-chipset Windows laptops at a site.
There are three predominant techniques applied to the enriched data to look for behavioral anomalies. These are applied on each site/WLAN combination.
DBSCAN
DBSCAN takes the events for each client, compresses them down into principal components, and then identifies clusters of devices in a multi-dimensional space. If an endpoint does not fit neatly into a cluster it is seen as an anomaly. If a device family has a high number of anomalies in the mixture it will be flagged.
COSINE DISTANCE
All healthy device families at a site are put into a group and their event mixture is analyzed to create the baseline. Then, each device family (healthy and unhealthy) is assessed to see if their cosine distance is significantly different than the healthy baseline. Cosine distance measures the difference in direction rather than scale, so this is not influenced by larger or smaller device groups.
MARKOV ANALYSIS
Markov chain techniques deal with the probability of the next event in the event chain. For example, if a user connects to the 802.1X network it is likely that a DHCP success would be the next event. Every site/WLAN combination creates a unique transition matrix that is refreshed each day. There were two methods of analysis in this set – Markov Anomaly, which flags when a client family is not reliably following the expected connectivity chain pattern established in the transition matrix, and Markov Stuck Loop which identifies when a client is stuck in a looping series of events (for example Auth Fail -> AP Deauth -> Auth Fail -> AP Deauth).
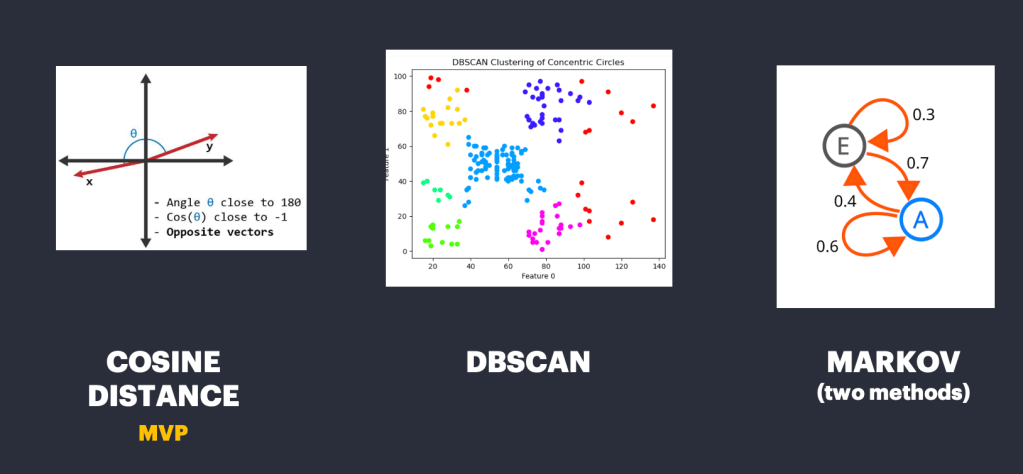
Ultimately the MVP for these techniques was Cosine Distance. It really can’t be considered unsupervised learning – more weakly supervised as it uses the device family health baseline as the label data – but it uncovered the most interesting findings by far and it would be my main focus if I were to run through this exercise again.
What did we find?
I had the opportunity to test this system out in several customer environments. During the testing we found multiple interesting issues:
- Fleet of air quality sensors that had been failing authentication because their key had not been rotated
- A lecture hall with about twenty Intel-based laptops that had been misconfigured with a bad machine cert
- Samsung TVs that were on the Guest network but had not been approved at the captive portal and they were constantly looping
- Issues with Amazon devices authenticating against WPA3 with a particular network config
- … and many more
If you’d like to give this a try in your environment you can access the GitHub repository here:
https://github.com/freemansean/device_family_anomaly_detection
Lessons Learned – A Network Engineer’s Retrospective on AI-Assisted Coding:
I walked away with several key takeaways from this whole exercise:
Domain Expertise is Still Important:
It’s still very important to understand how the sausage is made. For example, initial passes at this anomaly detection engine started flagging groups of endpoints as having authentication issues – specifically, groups of endpoints that could only be fingerprinted by their manufacturer information and not other elements like their OS, version, etc. If you understand how fingerprinting typically works at the network level you’ll know why that’s the case and why that was not an actual indicator of a device family seeing a universal issue. Most fingerprinting techniques require a DHCP or HTTP transaction and Auth Failures cut the client off before that can happen, leaving you with just the OUI information.
Underlying Telemetry is Important:
AI can be used to do all kinds of fancy tricks with the data, but if the data isn’t there in the first place you’re going to be limited in what you can uncover.
Features Are Getting Easier to Deploy:
Candidly, I wouldn’t have been able to even get started on something like this a few years ago… but this takes me to the next bullet point:
Just Because You Can Doesn’t Mean That You Should:
User Experience is a combination of art and science. AI makes it possible to introduce all kinds of new visualizations, abstractions, and config levers as they come to mind. While writing the user manual for the first pass of this system I quickly found that my ambition to cover every corner case was making the platform difficult to adopt for someone new to the system. Ultimately I had to revisit several components.
Clear Product Direction and Change Control are Critical:
Somewhat intertwined with the last bullet point, product direction and vision are key. This project grew organically and I often tripped myself up unexpectedly when a data handling decision I made early in the process was at odds with a more recent decision. If I had started with an overview of the complete architecture and sketched out exactly how I wanted the system to flow (and then enforced that architecture through the process) the system as a whole would have been less fragile.
In Closing:
Honestly, this exercise was a lot of fun and it served as a bit of a thesis project for all the ML courses I took over the last several years. It opened my eyes to a new way to interact with data, showed how to implement basic coding techniques, and revealed a little bit of the complexity that goes into proper software design… as was made apparent the first time I tried this on a large dataset. Increasing the scale introduced a lot of changes to the underlying split between SQLite and Redis, changes to the API call structure, and more.
Feel free to give the system a shot in your environment and let me know what you think; the GitHub is linked above.

 Concepts of Connection