

The Mist dashboard contains a lot of valuable information and insights for network automation, troubleshooting, and debugging. It can also be extended into other IT systems through the usage of the extensive webhook, websocket, and API systems available within Mist. Every single action in the GUI has a corresponding API call.
The first part of this blogpost will show you a few examples of how you can use Python and the Mist APIs to poll the Mist dashboard, store the results within InfluxDB, and then graph out the data using Grafana. This can be used effectively within a NOC to give a heads-up display of the health of the network – and importantly, you can determine exactly what data from the dashboard is important for your team and curate the experience. This can be used to create real-time “health” dashboards for each site and other similar systems without granting a lot of people direct access to Mist (and also combining it with other sources of telemetry into a single GUI).
Before diving in, here is a link to our API documentation and a very helpful browser extension that will help you navigate our API architecture.
- https://www.juniper.net/documentation/us/en/software/mist/api/http/getting-started/how-to-get-started
- https://github.com/Mist-Automation-Programmability/mist_browser_extension
For this exercise I’m hosting an Ubuntu VM with InfluxDB and Grafana installed. I won’t go into all the details of the setup here because there are many guides out there that will candidly be a lot better than what I could write – but I do want to take a moment to say a big thank you to Andreas Koksrud and Francois Verges for the incredible deep dive that they hosted at WLPC 2025 out in Phoenix.
InfluxDB is a time series database that can be used for storage and retrieval of time series data. There is a handy Python module that can be used to import data into InfluxDB. Here’s the function that writes a Python dictionary to a target InfluxDB datastore.
from influxdb import InfluxDBClient

def update_influxDB(measurement_name, hostname, fields):
    timestamp = datetime.now(timezone.utc).strftime('%Y-%m-%dT%H:%M:%SZ')
    json_body = [
        {
            "measurement": measurement_name,
            "tags": {
                "host": hostname,
            },
            "time": timestamp,
            "fields": fields
        }
    ]
    client = InfluxDBClient('localhost', {port}, {admin_name}, {admin_password}, {target_datastore})
    client.write_points(json_body)
    print(f"Updated InfluxDB with data at {timestamp}")
In this blogpost I’ll show you two methods to extract data from Mist. First we’ll cover API calls – a polling method – and then we’ll cover websockets – a subscription method.
api calls:
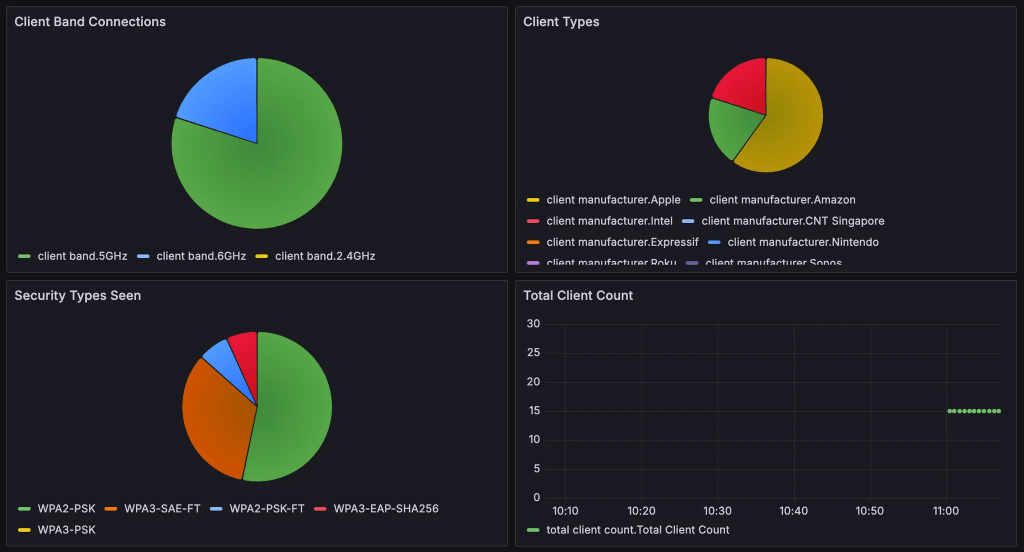
You can write a script that pulls data from the Mist dashboard and writes it to InfluxDB at set intervals. For this example I will show you how to aggregate client data across your entire organization, pull information like bands, security type, manufacturer from that statistics for each connected client and then write the relevant details to an InfluxDB database.
First, here’s a module that iterates across sites in your target org. This will return a dictionary of Site ID / Site Name mappings across your Mist organization that we can use in future calls.
def get_sites():
    url = f'https://{host}/api/v1/orgs/{org_id}/sites'
    payload = {}
    headers = {
    'Authorization': f'Token {apitoken}'
    }

    response = requests.request("GET", url, headers=headers, data=payload)
    response = response.json()
    site_list = {}
    for site in range(len(response)):
        site_id = response[site]['id']
        site_name = response[site]['name']
        site_list[site_id] = site_name
    return site_list
Next, here’s a module that pulls the device statistics for a given site ID:
def get_client_info(site):
    url = f'https://{host}/api/v1/sites/{site}/stats/clients'
    payload = {}
    headers = {
    'Authorization': f'Token {apitoken}'
    }

    response = requests.request("GET", url, headers=headers, data=payload)
    return response.json()
Now, here’s something that uses those two functions to aggregate client stats and pull the relevant information.
def check_clients():
    client_info = {}
    total_client_count = 0
    client_security = []
    client_mfg = []
    client_band = []
    for site in site_list:
        clients = get_client_info(site)
        site_client_count = len(clients)
        total_client_count += site_client_count
        for each in range(len(clients)):
            secvalue = clients[each]['key_mgmt']
            osvalue = clients[each]['manufacture']
            bandvalue = clients[each]['band']
            client_mfg.append(osvalue)
            client_security.append(secvalue)
            client_band.append(bandvalue)
    client_security_dict = dict(Counter(client_security))
    client_mfg_dict = dict(Counter(client_mfg))
    client_band_dict = dict(Counter(client_band))
    client_info['total'] = total_client_count
    update_influxDB('total client count', 'Packet Wrangling', client_info)
    update_influxDB('client security types', 'Packet Wrangling', client_security_dict )
    update_influxDB('client manufacturer', 'Packet Wrangling', client_mfg_dict)
    update_influxDB('client band', 'Packet Wrangling', client_band_dict)
This code block is a bit longer, so I’ll walk through the logic. This is specifically going to gather the client security type (to determine how many clients are using WPA2 and how many are using WPA3), the client manufacturer, and the band that they are using.
We create placeholder lists for each value, then iterate through the site_list we pulled earlier, grabbing the client stats from each site, and then grabbing the values from within client stats and adding them to the aggregate value lists. We also create a dictionary “client_info” that is somewhat underutilized here, it will just hold the total client count for now.
Once that is done, we use a handy function called Counter to create a dictionary for each area of interest. For example, if we have a list (client_band) that shows 12 values for 5GHz and 3 values for 6GHz, this function would return the following dictionary:
{'5': 12, '6': 3}We then write the InfluxDB database with these different dictionaries using the update_influxDB functions.
Tying it all together, here’s the code that will poll the org for the site list and then run these checks every 30 seconds.
site_list = get_sites()

while True:
    check_clients()
    time.sleep(30)
Now that the InfluxDB is populated, you can configure Grafana to pull this data from the InfluxDB datastore and start creating visualizations.
There’s a LOT that you can do with systems like this. You can create heads-up displays for alerts, APs going offline, client trends, and more. You can also extract the ML/AI infused alerts from the dashboard like Marvis Actions, or even poll the Marvis Minis results.
Websockets:
Now, let’s take this a step further and start adding in websocket feeds. The API call methods shown above allow you to be very prescriptive with the data you pull into Grafana, but a certain point of scale it will make sense to start taking advantage of webhooks and websockets. These allow you to stream data into the server.
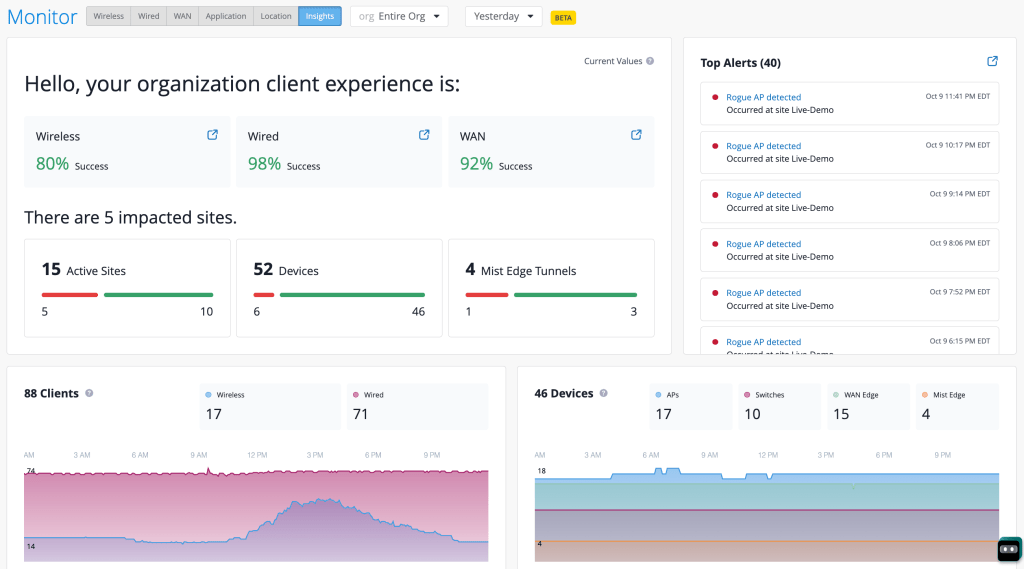
We just unveiled an impressive new view in the Mist GUI – Org Insights!
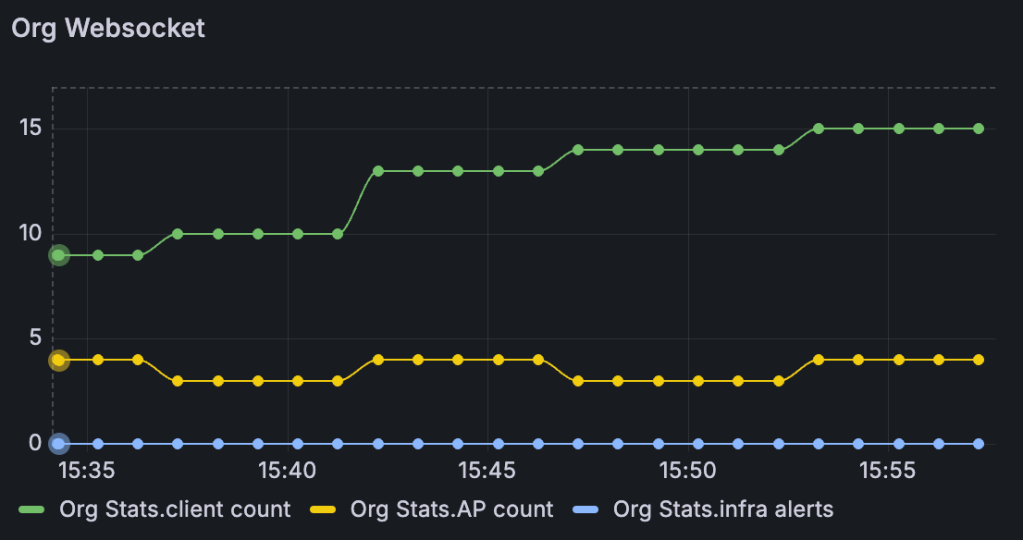
As part of this release we are also unveiling a new websocket feed for this view. Now you can subscribe to a org wide summary that feeds details like the number of clients, number of alerts, number of APs, and other useful stats on a minute-by-minute basis.
First let’s set the groundwork with asyncio and websocket modules. We also define the URI and the “subscribe string,” after we pass the authentication step we have to specify what stream we want to listen to.
import asyncio
import websockets
from websockets.asyncio.client import connect
uri = 'wss://api-ws.mist.com/api-ws/v1/stream'
subscribe_string = """{
        \"subscribe\": \"/orgs/[enter-your-org-id-here]/insights/summary\"
    }"""
Next, define a function that connects to the websocket with your previously defined API token and then sends over the subscribe string. Once data starts coming in we will refine the data into a dict object and load it into InfluxDB.
async def connect_with_token(uri, token, max_retries=5, initial_delay=1):
    headers = {"Authorization": f"token {apitoken}"}
    async with websockets.connect(uri, additional_headers=headers) as websocket:
        print(f"Connected to {uri}")
        await websocket.send(subscribe_string)
        print(f">>> Sent: {subscribe_string}")
        while True:
            try:
                message = await websocket.recv()
                messagejson = json.loads(message)
                if 'data' in messagejson:
                    data = json.loads(messagejson['data'])
                    update_influxDB('Org Stats', 'Packet Wrangling', data)
            except websockets.exceptions.ConnectionClosed:
                print("Connection closed by server")
                break
            except Exception as e:
                print(f"An error occurred: {e}")
                break
Here’s a sample of the output that will come from the org insights summary websocket:
"data": "{\"timestamp\":1760092606,\"num_aps\":2,\"num_disconnected_aps\":1,\"num_switches\":1,\"num_disconnected_switches\":11,\"num_gateways\":1,\"num_disconnected_gateways\":1,\"num_mxedges\":0,\"num_disconnected_mxedges\":3,\"num_mxtunnels\":0,\"num_active_wan_tunnels\":0,\"num_inactive_wan_tunnels\":0,\"num_wan_clients\":1,\"num_wired_clients\":8,\"num_clients\":12,\"num_nac_clients\":0,\"num_client_auth\":1,\"num_wired_client_auth\":0,\"num_nac_client_auth\":0,\"num_client_events\":0,\"num_device_events\":0,\"num_security_alerts\":1,\"num_infra_alerts\":0,\"num_marvis_alerts\":0,\"num_inactive_mxtunnels\":0,\"sle_summary_wireless\":1.0,\"sle_summary_wired\":1.0,\"sle_summary_wan\":1.0,\"num_sites\":2,\"num_degraded_sites\":0}"Voila, now you have a lot more data to play with in Grafana – org wide SLE summary, active APs, active clients, active alerts, and much more.
For more details on this new Org Insights websocket:
If you want to have both of these methods running simultaneously from the same Python environment you can use multithreading. Here’s a quick sample script:
import threading
import subprocess

def run_script(script_name):
    subprocess.run(["python", script_name])

if __name__ == "__main__":
    script1_thread = threading.Thread(target=run_script, args=("websocket.py",))
    script2_thread = threading.Thread(target=run_script, args=("script_org.py",))

    script1_thread.start()
    script2_thread.start()
Simply replace the ‘websocket.py’ and ‘script_org.py’ with your script names and execute the multithreading script from the same directory where you have your API call script and your websocket script. This will trigger the websocket subscription as well as kickstart the API calls.
