
One of my favorite components of the Mist platform is the microservices architecture running underneath the hood. This architecture brings a lot of operational advantages – resiliency, stability, speed, scale – and it brings new features into the dashboard on a regular basis.
Earlier this week we launched a new feature that I’ve been watching for a long time… the augmentation of our continuous user experience learning system! This plays very well into my previous post about using ML techniques like XGBoost and Shapley to quantify the network performance.
Want to learn more about how Mist can now pinpoint and quantify the exact network culprits for a bad Zoom call? Read on…
SUPERVISED vs. UNSUPERVISED LEARNING
There are four major classes of ML/AI techniques in data science, each of them leveraged in some form or fashion within the Mist platform:
- Supervised Learning
- Unsupervised Learning
- Reinforcement Learning
- Generative AI
Supervised Learning is where we train the model on data that already “has the answer” – IE, we already have the dependent variable values in the training data. For example, if we are developing an image recognition model that is built to identify images of network closets, we would train the model on a large dataset that would have images with accurate labels applied – “Network Closet” or “Not Network Closet” – and the model would learn the difference between the two. Supervised Learning techniques include systems like Decision Trees, Random Forest, XGBoost, Regressions, and more.
Unsupervised Learning is where the model is trained on data that is NOT labelled. Large amounts of bulk data is given to the model and the model finds its own groups and clusters in the data. Unsupervised Learning is used for K-means Clustering, DBSCAN, and other similar systems. It is specifically used for location services in Mist.
Supervised Learning techniques have many practical applications but getting the training data can sometimes be expensive or difficult, as someone or something has to take the time to apply a label or a value to each data entry before the model can be trained.
You may be asking yourself… why am I taking so long in a network-focused technical blog to delineate between supervised and unsupervised learning?
APPLICATION INSIGHTS:
Application Insights is the framework that allows Mist to ingest data from external sources – data from popular conferencing / collaboration tools like Zoom and Microsoft Teams. These cloud-to-cloud integrations continuously pull performance data reported directly by the client into the Mist dashboard, feeding Mist a wealth of data on client-side metrics like audio latency in, video latency in, audio latency out, CPU utilization, and more.
As network administrators we have always been keen to know if someone is having a call that could be considered “bad.” In the past we have used domain expertise to quantify this – for example, if someone is connected to an AP that is extremely congested or overloaded we can make a reasonable assumption that their application is going to be impacted negatively. If someone is at a site where the WAN circuit has run out of bandwidth and packets are being dropped we can make a similar assumption that things are not going to go well if multiple people launch a Teams session. However there are many, many factors in the network connectivity chain and it can be difficult to quantify which network element is truly causing the pain at the application level.
All of these network-side factors (features) like RF congestion and WAN latency are continuously logged by Mist as part of regular operations. Now by consuming client-side latency metrics through the Application Insights framework the loop has been closed – we have a full set of independent variables present with the network data and now the client-side latency data is loaded in as the dependent variable – and this age-old question of “what caused the bad experience” can be tackled with supervised learning techniques.
CONTINUOUS USER EXPERIENCE LEARNING:
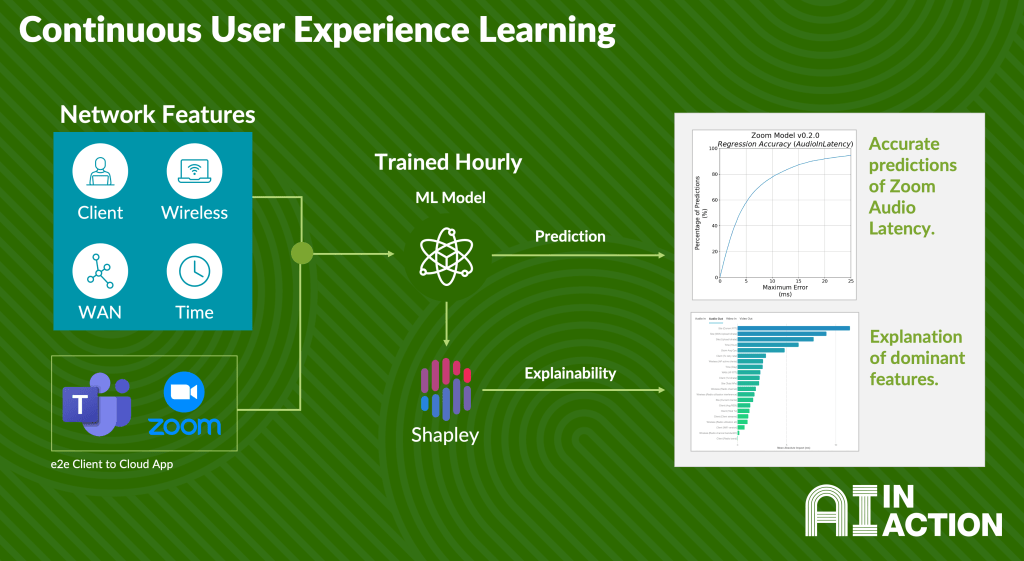
This new extension of the Application Insights system has two components:
- First, a ML model that continuously trains using a combination of your network features (X) and application metrics (y) to determine what network features are correlated with application latency.
- Second, an application of Shapley techniques on this model to explain root cause and highlight the dominant network features that are hurting your application experience.
My previous blog post showed a similar “lab” exercise to leverage coverage metrics and device / site details to uncover trends with ML techniques – this new launch of the continuous user experience learning framework takes those concepts much, much further.
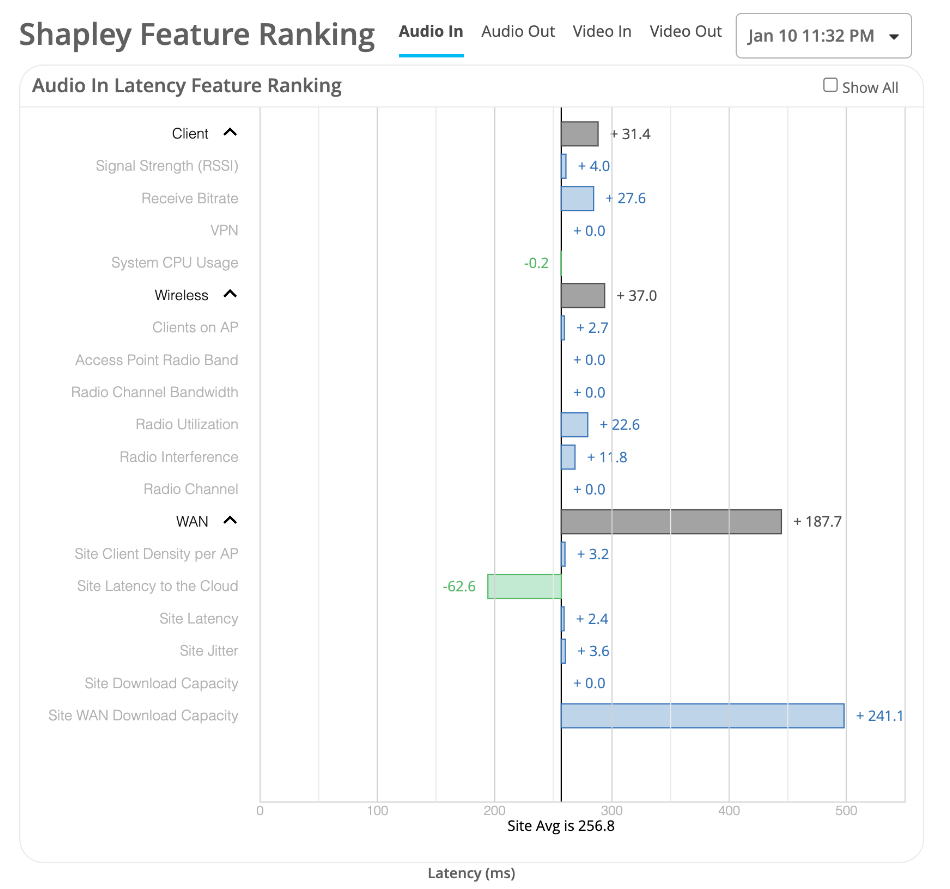
So what does this enhancement introduce for the enterprise? You can now pinpoint and quantify which step in the network connectivity chain is causing pain at the application level. For example, here’s the Shapley analysis of a poor call where the WAN download capacity ultimately was the culprit:
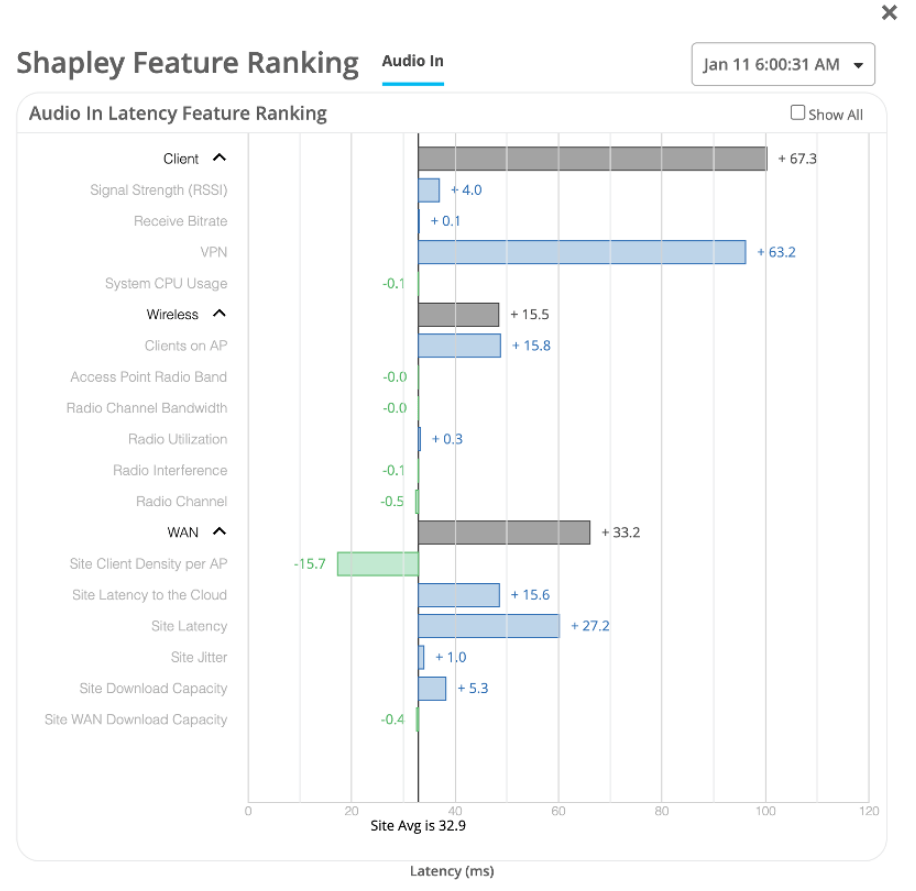
Here’s another example of a poor call where a misconfiguration of the VPN client contributed towards the poor call experience:
Shapley techniques were originally developed as cooperative game theory and intended to quantify how much different players on a team were contributing to a shared objective. In this case Mist is flipping that method around – rather than tracking how much each component on the network is contributing to the win, we are tracking how much each component is adding to the total latency on the Zoom call.
For more information on SHAP: https://shap.readthedocs.io/en/latest/
To read the official documentation on this feature: https://www.juniper.net/documentation/us/en/software/mist/mist-zoom-integration/zoom-integration/topics/task/troubleshoot-zoom-calls-using-shapley-feature-ranking.html
This enhancement is now live in your Mist dashboard if you have a VNA subscription – go ahead and give it a try!
